In this tutorial we’re going to look at the two Progress analysis screens for the Cherry Garden framework on Tapestry.
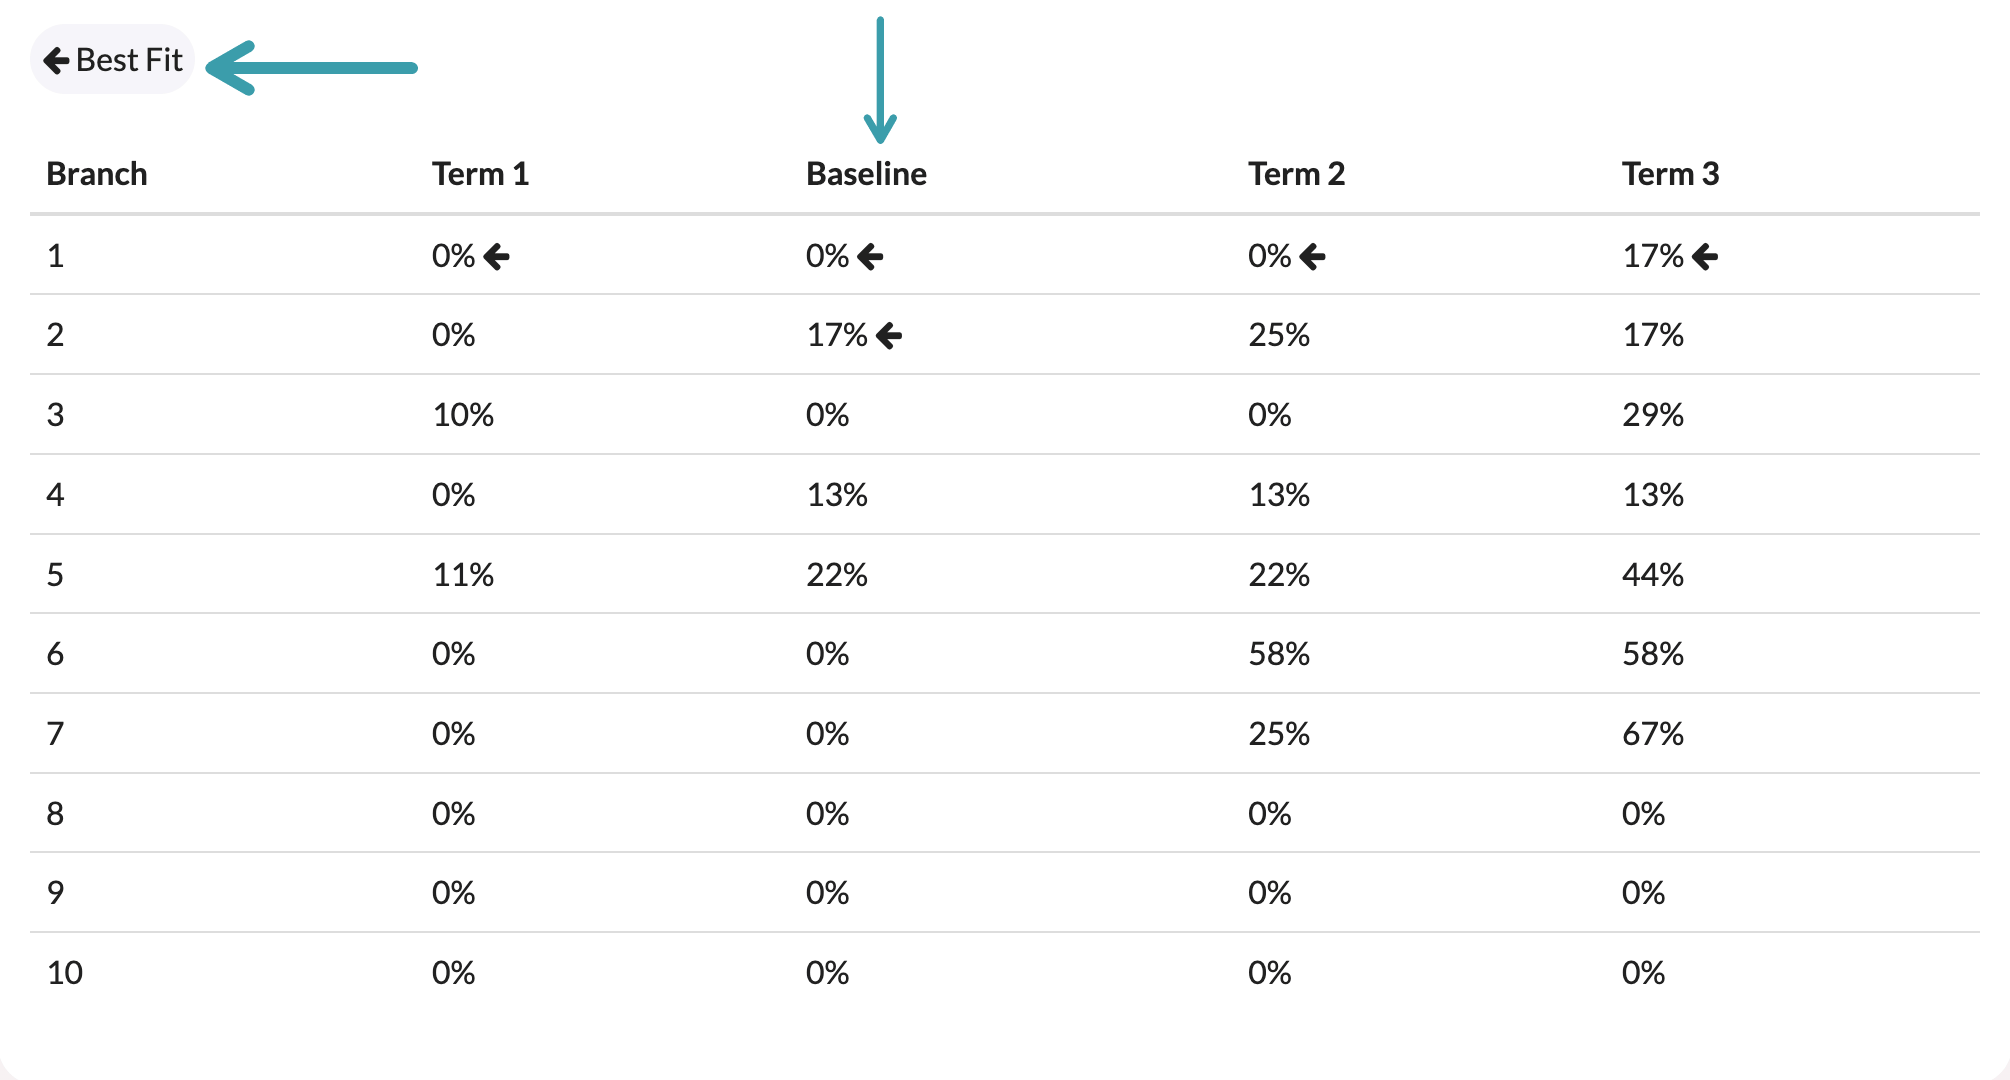
Term Progress shows a child’s percentage score for every branch of a strand, period by period, with a marker for their best fit branch. Targets Progress compares two points in the year and measures the change — against the targets you’ve set, if you’ve set them.
To get there, click Planning & Monitoring in the menu on the left, then select Monitoring from the panel that opens.
On the Monitoring page, select the Cherry Garden tab and find Progress in the Analysis column — it offers Term Progress and Targets Progress.
You can open Targets Progress without setting any targets — the scores still show — but it earns its keep once targets exist. Our Cherry Garden: Target Setting tutorial covers those.
Note that these analysis screens are Cherry Garden only — Cherry Garden Bridging doesn’t have an equivalent.
Term Progress tracks one child, one strand at a time, across the year’s assessment periods.
Choosing what to show
Pick the Year, then the Periods — this one’s a multi-select, and starts with every period ticked — then the Child and the Strand.
Reading the table
Each row is a branch of the strand and each column a period, with the child’s percentage score in every cell — so you can watch a branch climb across the year. If the year you’re viewing is the one the child’s baseline belongs to, a Baseline column slots in among the terms too.
The Best Fit arrow marks the branch Tapestry judges the child to be working at — the lowest branch still under your school’s Best Fit Threshold, which is 80% by default and adjustable by managers in the framework’s configuration.
Targets Progress compares two points in the year and shows the movement between them, branch by branch.
Choosing what to compare
Pick the Year, then a Start Period and an End Period — the start must come before the end. When you’re viewing the year of the child’s baseline, Baseline is offered as the start too, and Tapestry selects it for you. Finish with the Child and Strand.
Reading the table
Each branch row shows the child’s percentage at the start, at the end, and the Progress between the two in percentage points.
The Targets row along the bottom shows any target set for the year — the branch and completion aimed for — with a green tick when the child’s score has met it. Periods without a target simply read No target.
And that’s it! Term Progress shows the climb, period by period; Targets Progress measures the distance travelled — and whether it got the child where you’d aimed.