In this tutorial we’re going to look at the Key Stage Coverage screen.
It shows how much of the curriculum has been taught and assessed – the proportion of statements each child has been assessed on, and how many statements have been covered for at least one child in each group.
Finding the Coverage screen
Click Planning & Monitoring in the menu on the left, then Monitoring.
Select the tab for the year group you’d like to look at — KS1 Y1 in our example. Under Analysis, click Group View in the Coverage box.
Managers can always see the Key Stage Analysis screens. Staff will only see the Analysis section of the Monitoring page if a manager has given them the Use Analysis permission – this is switched off for staff by default.
Choosing what to analyse
Along the top of the screen you can switch between the year groups. Beneath them, the statements button shows how many statements are included in the analysis — all of them to begin with.
To narrow things down, click this button.
Tick or untick whole subjects, or click + to open a subject and choose individual areas, aspects or statements. When you’re happy, click the button at the bottom — it tells you how many statements you’ve chosen. We’ve kept just English.
The statements button now shows how many statements you’ve chosen. Check the year and term menus show the period you’re interested in — they start on the current term.
The Groups section decides which children are included. To begin with there’s a single group, All Children.
Click its No filters set button to narrow it down by cohort, group, key person, room and more, and give it a Display name so you can tell it apart; click Apply when you’re done.
Use Add Group to compare up to nine groups side by side — each gets its own colour in the chart.
Reading the table
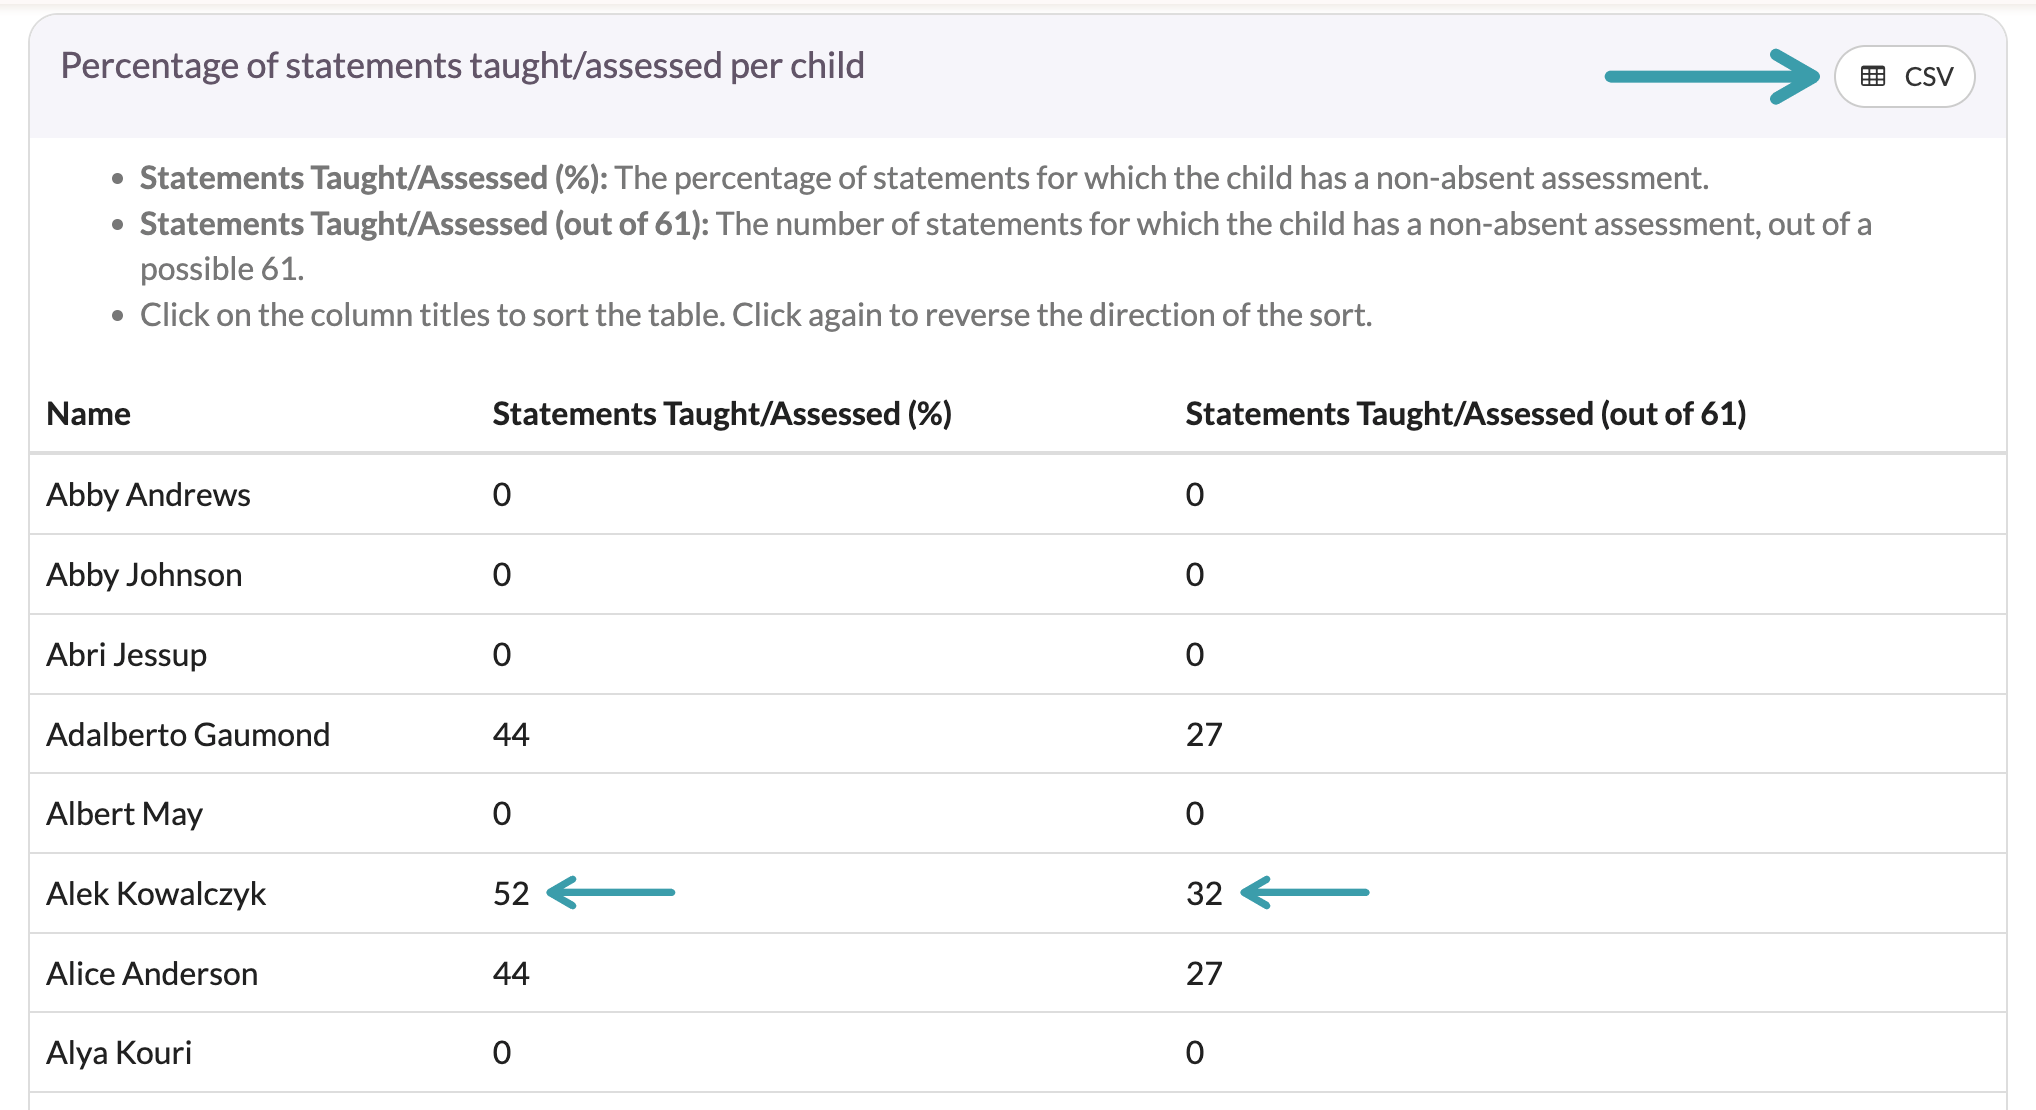
The Percentage of statements taught/assessed per child table lists each child with:
- Statements Taught/Assessed (%) — the percentage of the chosen statements they’ve been assessed on;
- Statements Taught/Assessed (out of…) — the same as a count, out of the number of statements you’ve chosen.
A statement only counts if the child has been assessed at one of your tiers — statements marked Absent don’t count as taught.
Reading the chart
The Percentage of statements taught/assessed for any child chart looks at each group as a whole: a statement counts as covered if at least one child in the group has been assessed on it (not as Absent).
Each group has its own colour, so you can compare how much of the curriculum each has covered.
Exporting
There are three ways to take the analysis away with you:
- PDF, beneath the filters, creates a printable copy of the whole screen;
- CSV, on the Percentage of statements taught/assessed per child panel, downloads the table as a spreadsheet;
- Image, on the Percentage of statements taught/assessed for any child panel, saves the chart as a picture.
And that’s it! We’ve found the Coverage screen, chosen the statements, term and groups to analyse, and seen how much of the curriculum has been covered for each child and for each group — and how to export the results.